Bitcoin Holder Accumulation Surged As Metrics Fell To Record Lows


Bitcoin’s (BTC) lowest-ever readings on the daily and two-week relative strength index (RSI) are coinciding with steady accumulation across several investor cohorts, strengthening what one analyst called the “best thesis” for buying BTC.
Onchain data shows wallets holding 1,000–10,000 BTC added more than 53,000 BTC over the past 60 days, while smaller retail investors also increased their holdings.
BTC accumulation grows across key cohorts
MN Capital founder Michael van de Poppe highlighted Bitcoin’s historically weak momentum readings as a potential long-term opportunity.
“The lowest Bitcoin read on the 2-Week RSI, and Daily RSI EVER. That’s the best thesis for accumulating and buying your Bitcoin,” van de Poppe said, adding that the panic-driven selling could continue while presenting rare buying opportunities.
Onchain data supports part of that view. Glassnode’s Accumulation Trend Score shows the strongest buying activity among smaller holders and select mid-sized investors. BTC wallets holding less than 0.1 BTC recorded a score of 0.78, the highest among the tracked cohorts. The 10–100 BTC group followed with a score of 0.71, signaling consistent accumulation over recent weeks.
Bitcoin accumulation trend score. Source: CryptoQuant
Some larger holders have also been active buyers. Over the past 60 days, wallets holding 1,000–10,000 BTC added 53,042 BTC, the largest increase among all cohorts. Addresses holding 100–1,000 BTC accumulated another 12,233 BTC, while the 10–100 BTC group added 1,283 BTC.
However, a different picture emerged among the largest entities. BTC wallets holding more than 10,000 BTC reduced balances by 39,840 BTC during the same period. Smaller groups holding between 1 and 10 BTC also trimmed exposure. The positioning split points to sustained demand from whales below the largest cohort and from retail investors accumulating into weakness.
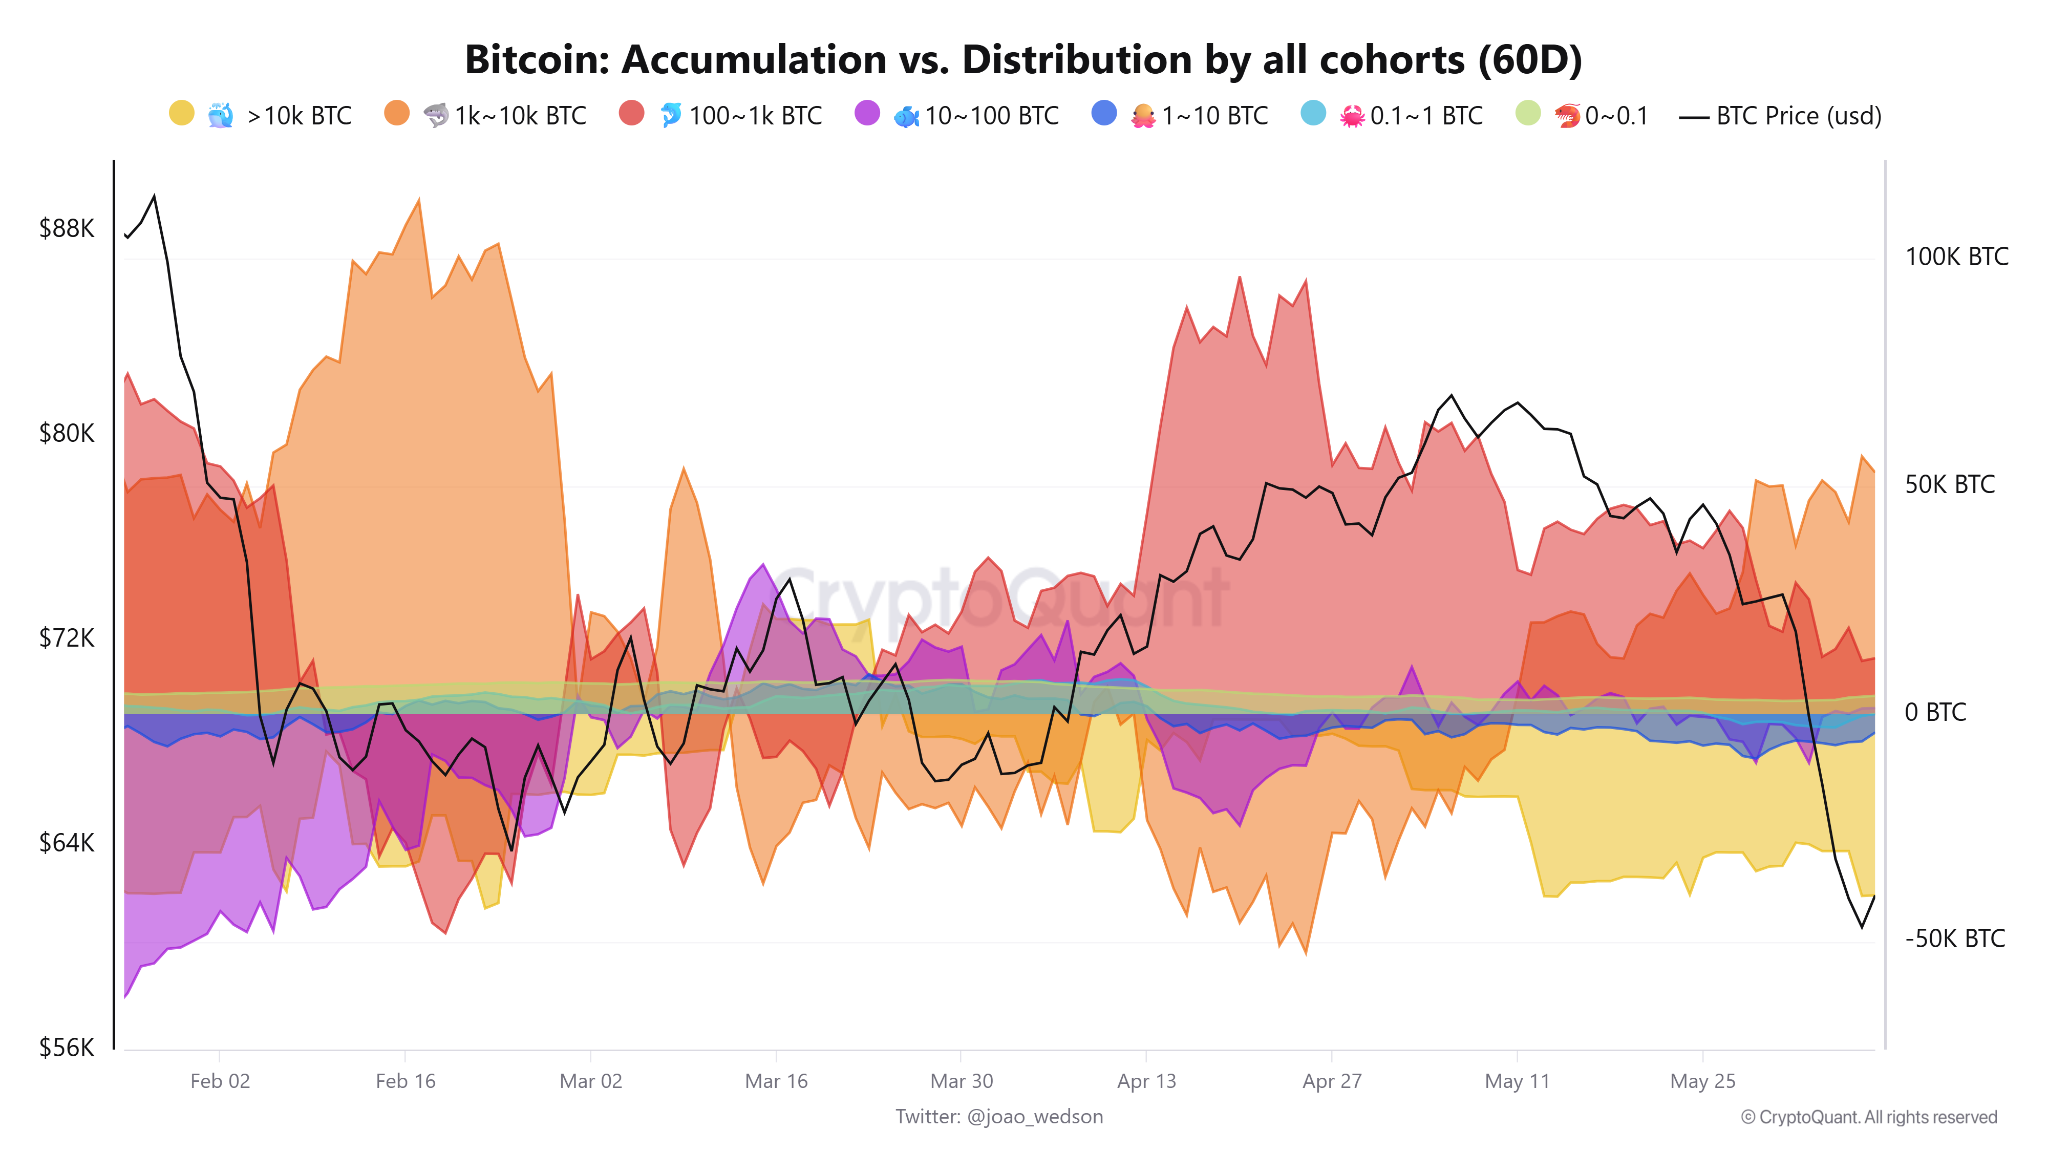
Bitcoin accumulation vs distribution (60-day change). Source: CryptoQuant
Related: Bitcoin price eyes $90K as FTX-era BTC bullish divergence flashes again
Analysts map potential bottom zones below $60,000
Market analyst Titan of Crypto highlighted a quarterly fair value gap (FVG) between $56,800 and $44,600. An FVG is a price imbalance created when Bitcoin moves sharply in one direction over a short period, leaving a zone with relatively little trading activity.
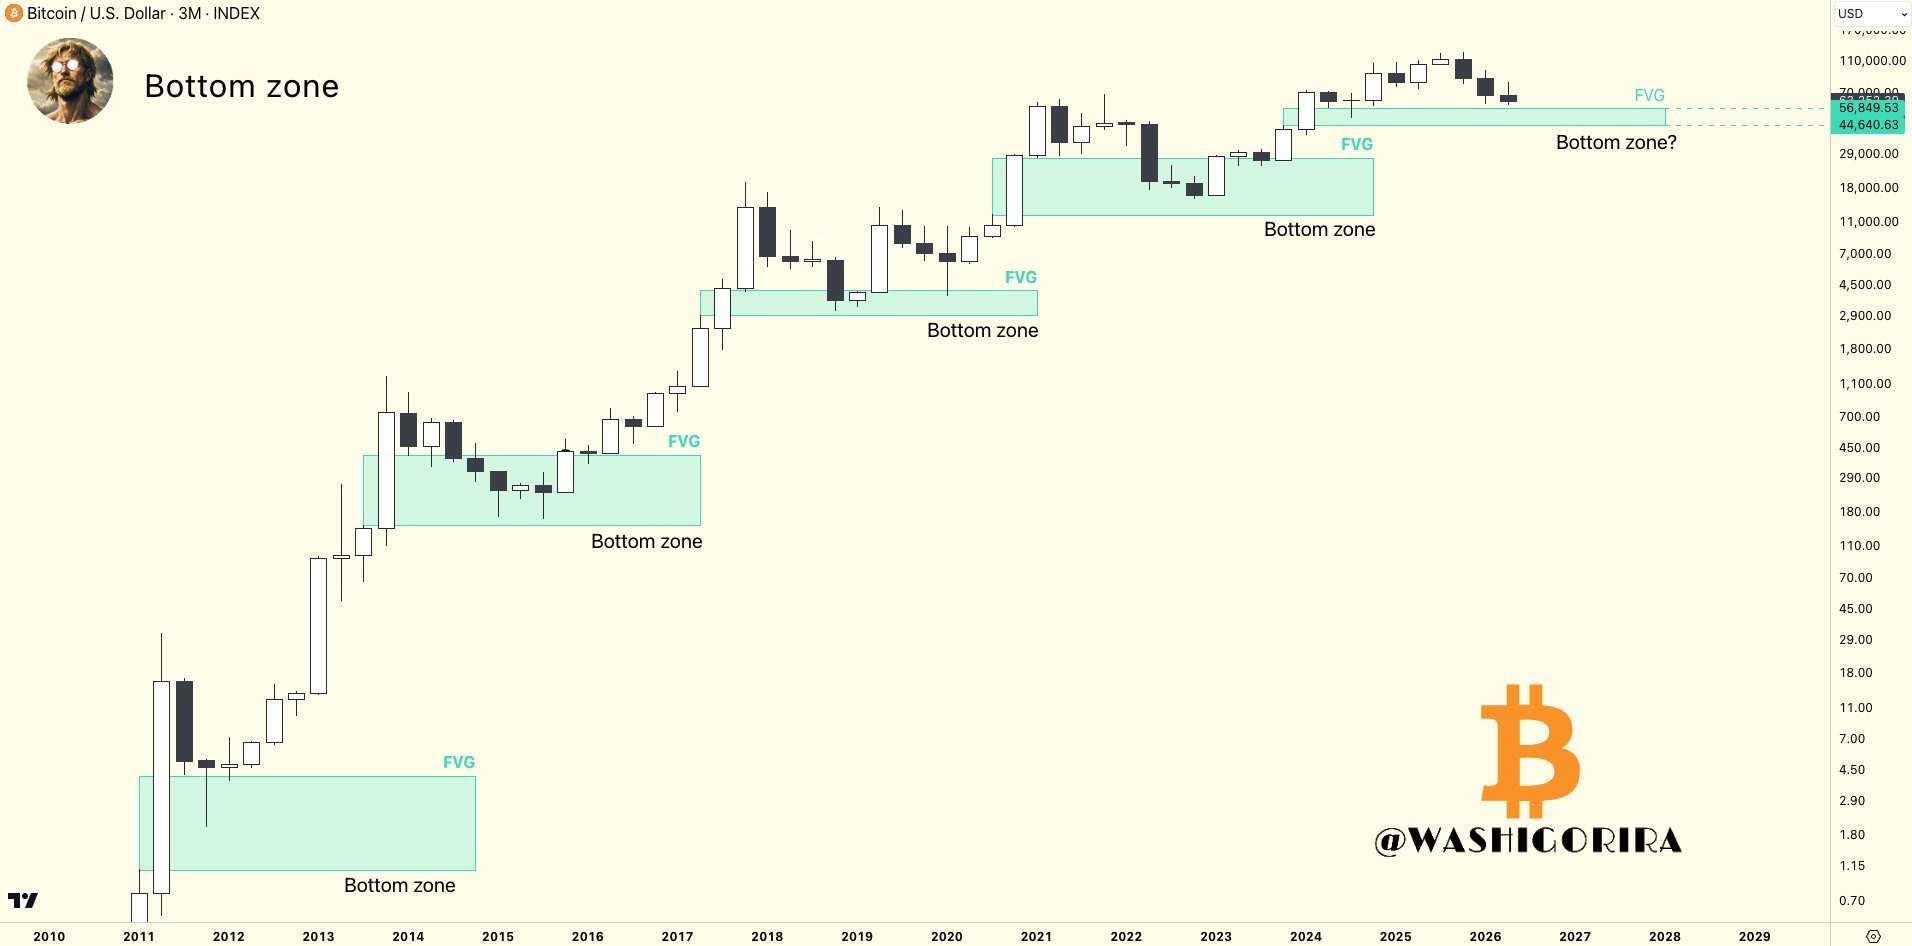
BTC quarterly price and FVG analysis by Titan of Crypto. Source: X
The quarterly chart shows that Bitcoin revisited similar imbalance zones created in 2011, 2013, 2017, and 2020 before establishing a bottom. The latest gap, formed in 2024, remains unfilled, making the $56,800–$44,600 range an important bracket if the current correction extends further.
Meanwhile, Glassnode co-founder Rafael pointed to Bitcoin’s cumulative value days destroyed-to-price ratio (CVDD), a long-term valuation metric that compares the market price to a historical cost basis floor derived from coin-holding behavior. The ratio currently sits near 0.73 and has historically approached 1.0 near major cycle bottoms.
With the CVDD floor near $46,000, Rafael said a similar pattern would place a potential bottom in the $52,000–$59,000 range.
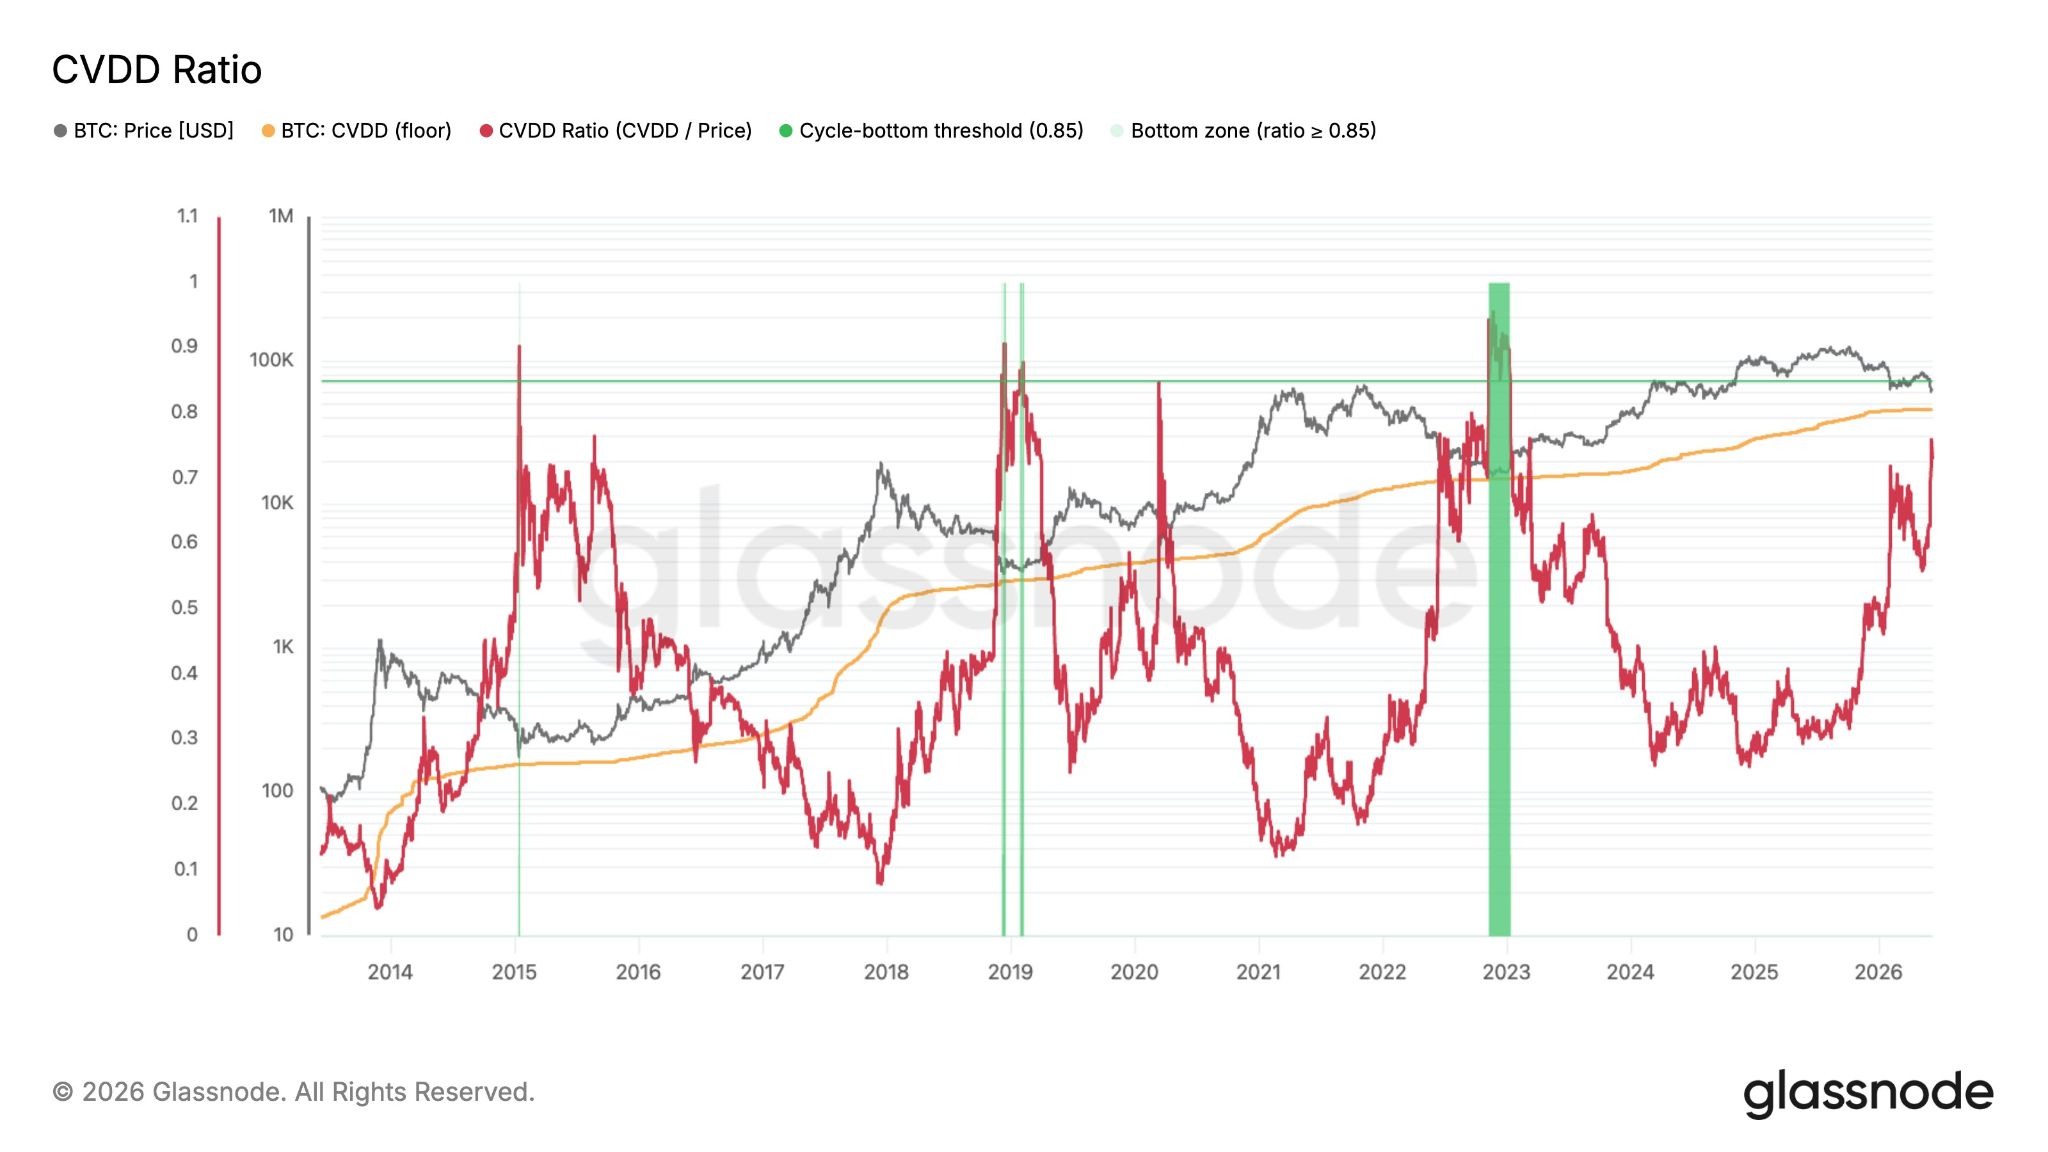
Bitcoin CVDD ratio. Source: Rafael/X
Related: Spot Bitcoin ETFs bleed $1.7B as outflow streak hits four weeks